On 08/03/2023 SAP Data Warehouse Cloud was renamed SAP Datasphere. We have recovered this blogpostpublished by our consultant Carlos Pinto on 18/01/2020 in the SAP Community shortly after the launch of SAP Data Warehouse Cloud
As the great Cal Loudon mentioned in this excellent blog, SAP announced in May a new data warehousing product, SAP Data Warehouse Cloud, which was generally available at the end of last year.
In that interval, I was actively participating in the Beta program, providing feedback and suggestions to SAP. In this blog I will carry out a practical exercise, the analysis of the UK population, and will comment my impressions on the tool.
If you are interested in testing the tool you can register for a free trial here.
First impression – Louis, I think this is the beginning of a beautiful friendship
The first look of the tool is very positive: an attractive user interface, clean and intuitive; with a welcome panel in the centre; and another panel on the left from which you can access the different areas of the tool: Administration, Security (Users, Roles and Activities), Connections, Space Management, Data Builder, Story Builder and Business Catalog.
Also noteworthy are the Help (with links to videos and guides, the toggle in-app help, etc.) and My Products (from which we can switch between tools: DW or SAC) buttons in the upper right corner.
But without further delay, let’s start building the story!
Step 1 – Create a user
The first step is to create a user, this is as simple as going to Security à Users, clicking + and filling in the following fields: User ID, First Name, Last Name, Display Name, Email and Roles.
Regarding the roles, I have assigned the six available roles, you can find more information about them here. The authorizations at data level (similar to analysis authorizations in BW and analytic privileges in HANA) are still under development.
Step 2 – Create a space
Once the user is created, you must create a space, that is the Virtual workspace where the data models and stories are stored.
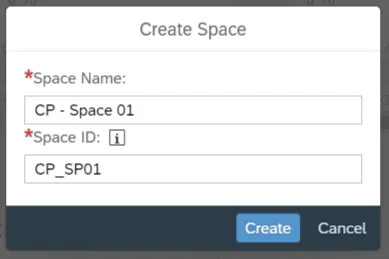
To do this, go to Space Management, click the + icon and assign a Name and ID:
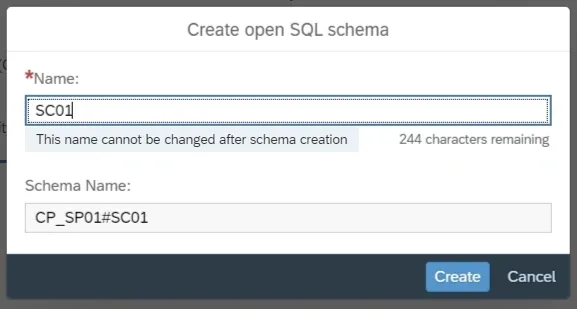
After assigning your user to the space, you must create a scheme which will contain the database objects of your space:
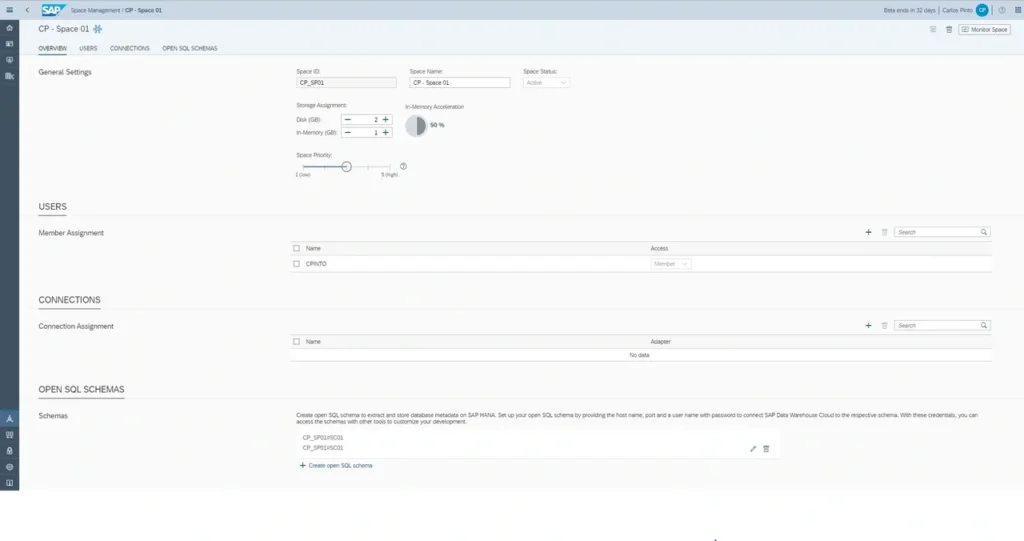
Two considerations before moving on to the next step: for this example, I can leave the default configuration (Storage Assignment and Space Priority) as it is and I do not need to add any connection as I will import the data from CSV files.
Step 3 – Import the files…
Once the user and space are created, you can create the Data Model. The first step will be to import the files and the second to create the graphical view.
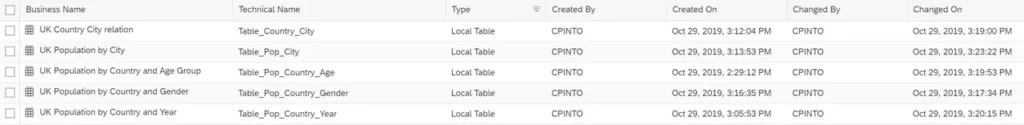
For this example, I will use five files with the Estimates of the UK population from the ONS website, the National Statistical Institute of the UK.
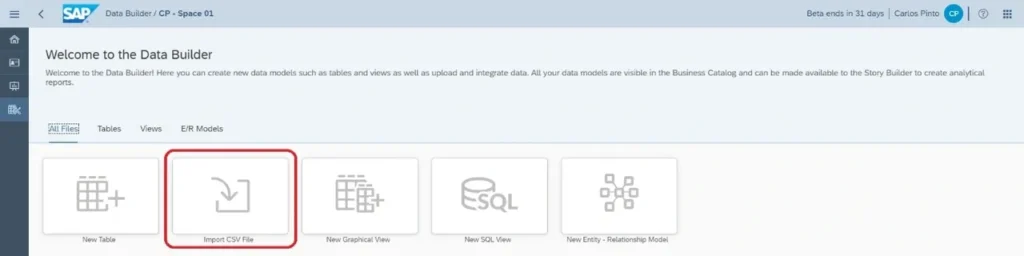
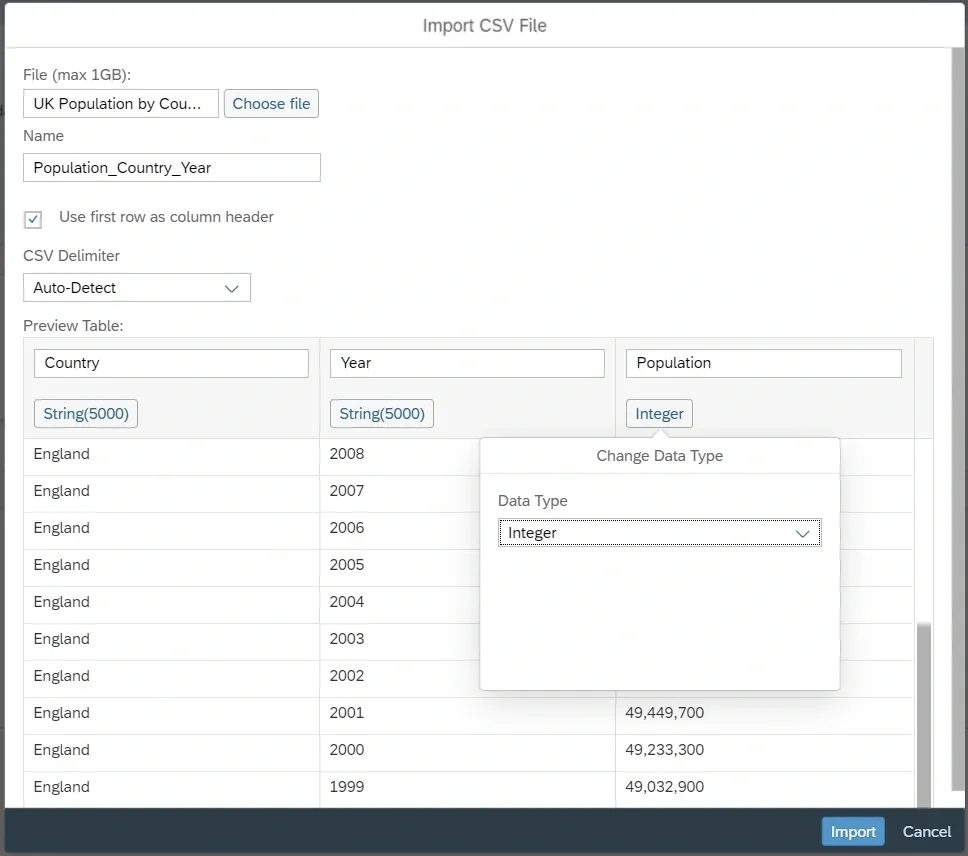
To import the files, go to the Data Builder, select the space created in the previous step and click Import CSV File:
After selecting the file, you can change the name of the table that will be created, and the data types assigned by default. In this example I will change the table name and the type of ‘Population’ (Integer instead of String (5000)):
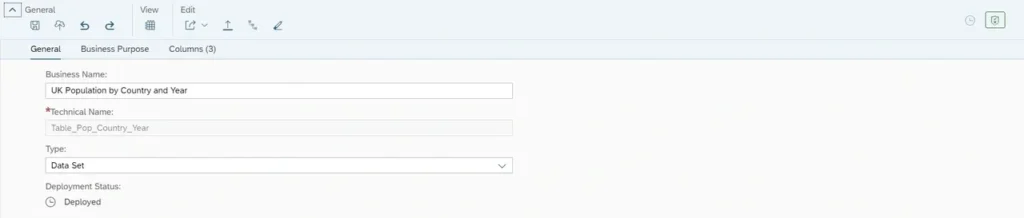
After clicking Import, you can make changes at three levels:
General: business name and type (data set, dimension, fact).
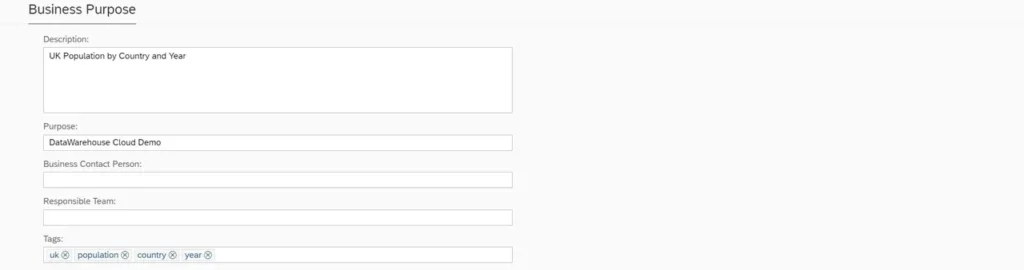
Business purpose: description, purpose, business contact person, responsible team and tags.
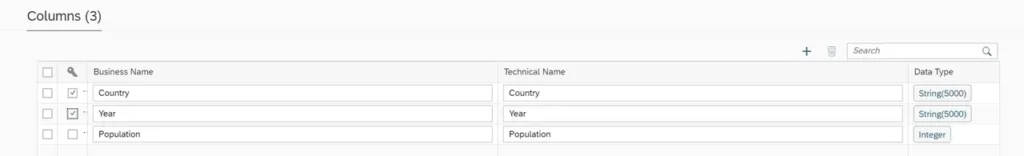
Attributes & Measures: key, business name, technical name, data type, semantic type and label column, for the attributes. And the aggregation (SUM, COUNT, MIN, MAX, NONE) in the case of measures.
Each time the structure of the table is changed (e.g. key fields), the data of the table has to be deleted, the table has to be deployed, and the data has to be uploaded again.
To make sure everything is fine you can show a data preview:
Step 4 – Create the Graphical Views
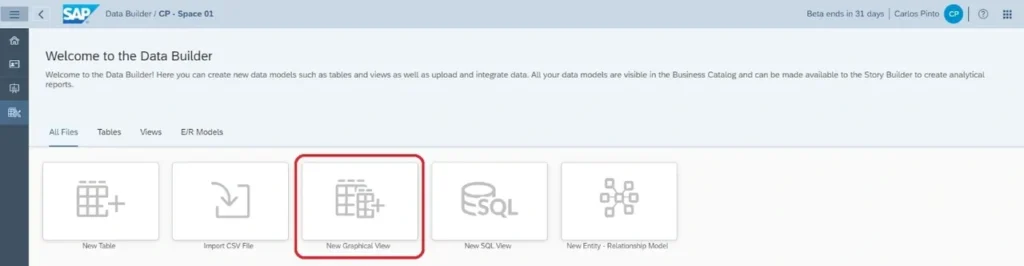
Once the files are uploaded, you can create the Graphical Views, that will be the basis of your story.
For this, go to the Data Builder and click New Graphical View:
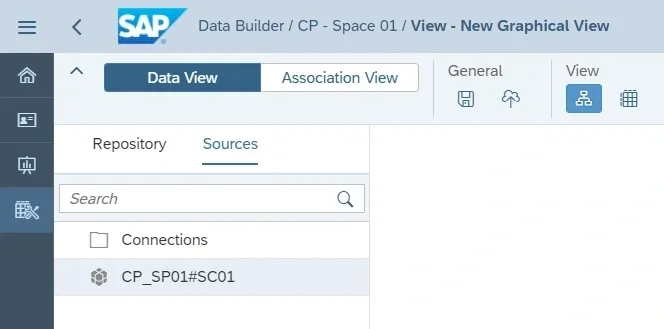
Here you can merge data from other schemes in your space or from other connected source systems. In this example I will only have one source: the scheme I created in step 2.
The repository shows all the tables and views of the selected source. To create a view, it’s as simple as dragging the tables you need and configuring the ‘Join’, ‘Projection’ and ‘Output’ nodes.
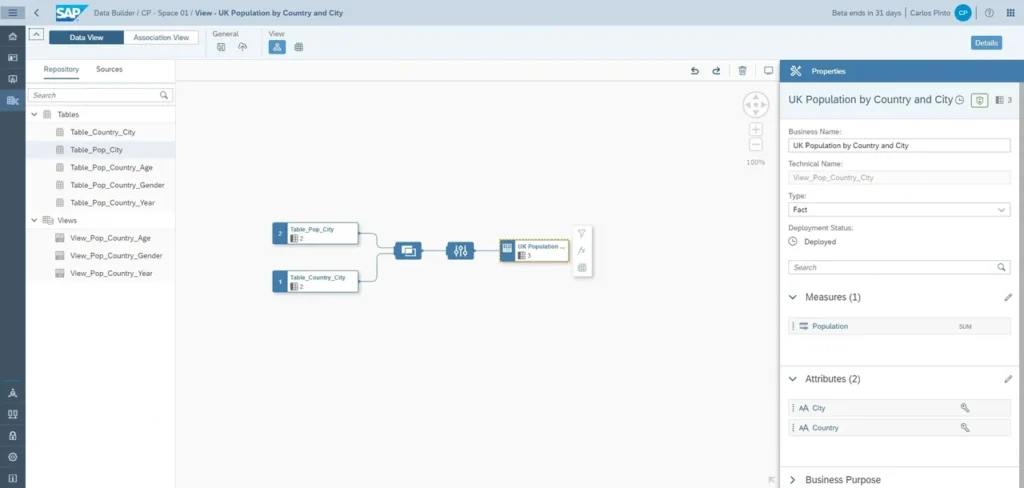
In this example I need to create the join between the ‘Cities – Population’ and ‘Countries – Cities’ tables to get the ‘Countries – Cities – Population’ relation. To do this, I drag one of the tables and then drag the second table over the first one. As shown below, the view is automatically generated:
Now you can configure the three nodes mentioned previously:
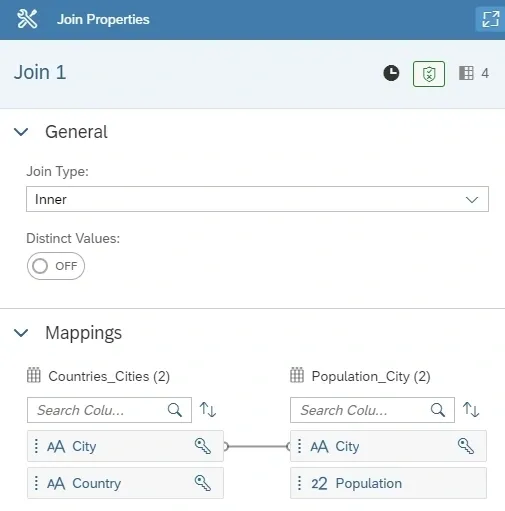
Join: you can select the join type (Cross, Full, Inner, Left, Natural, Right), Distinct Values (if you do not want duplicate values) and modify the default generated mapping.
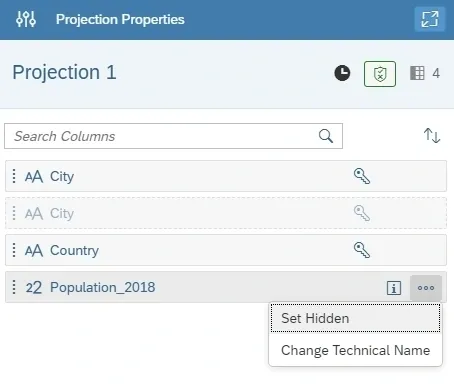
Projection: for each column you can hide it or change its technical name.
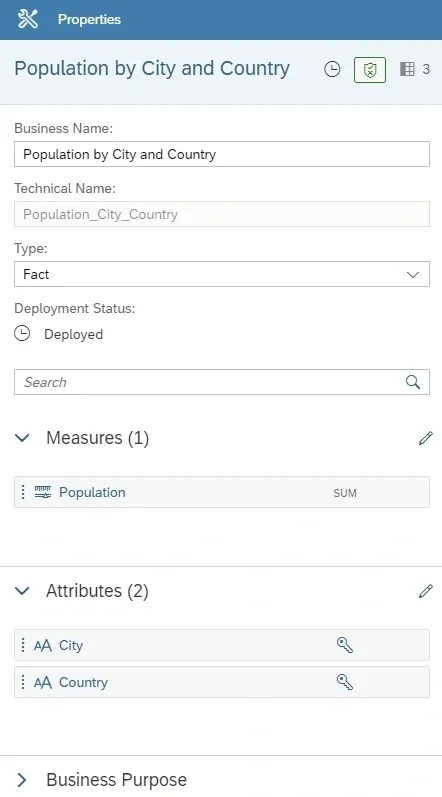
Output: exactly the same parameterization options (General, Business Purpose and Attributes & Measures) that we saw for the tables in the previous step.
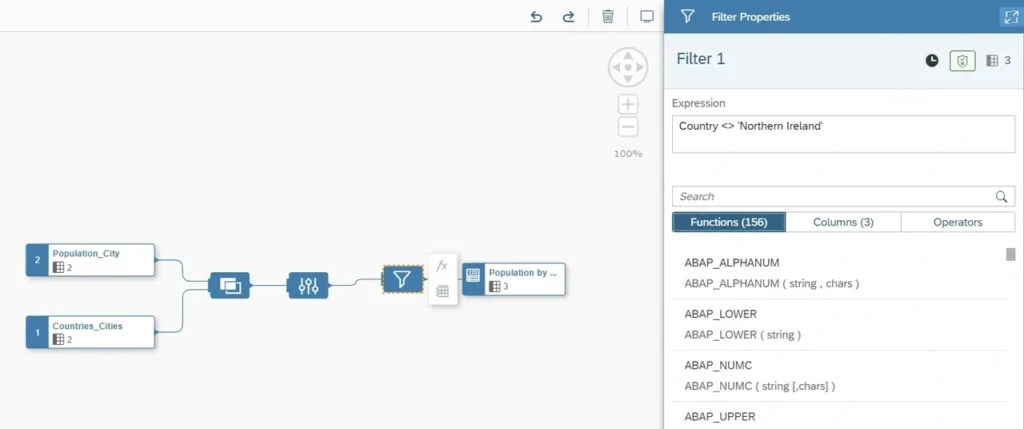
For each node you have three different options: ‘Filter’, ‘Calculated Columns’ or ‘Preview Data’.
For example, if we want to show only the population of Great Britain data we can filter by Country <> ‘Northern Ireland’:
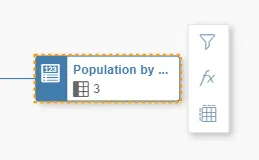
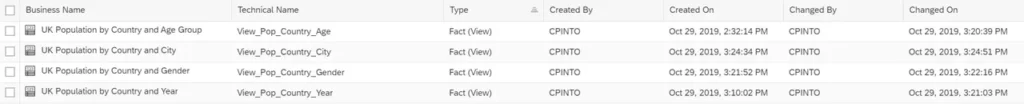
Once this Graphical View (Population by Country and City) is created, I will create three more views: Population by Country and Gender, Population by Country and Age Group and Population by Country and Year:
Step 5 – Add Semantic Layer
As mentioned in this blog, adding the semantic layer consists of adding meaning or context, written in natural language, to the data technical fields to allow the business users to understand the data.
This is something that I have already been doing while creating the data model. It consists of completing the fields related to the Business Purpose section of the Tables, Views and Output nodes (Description, Purpose, Business Contact Person, Responsible Team and Tags), as well as the business names of the different Attributes and Measures.
Step 6 – Create a story
Once created the four data models, you can instantly discover insights by creating your story. This is one of the great advantages of DWC: having SAC embedded, we have the Data Warehouse and Analytics services in one single tool.
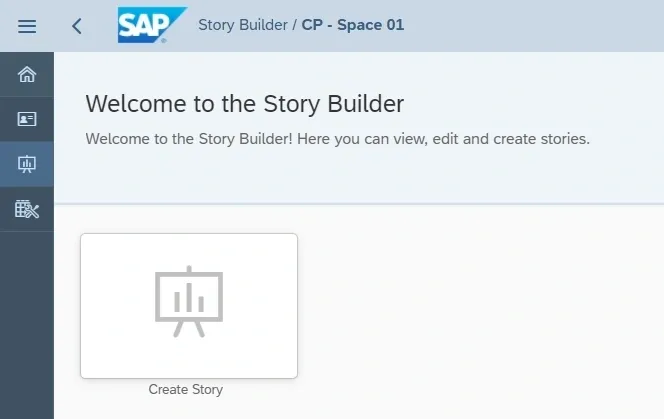
For this, go to the Story Builder on the left panel and click Create Story:
The next step is to select the data model you want to start with (the rest of the data models will be selected later) and start building your story:
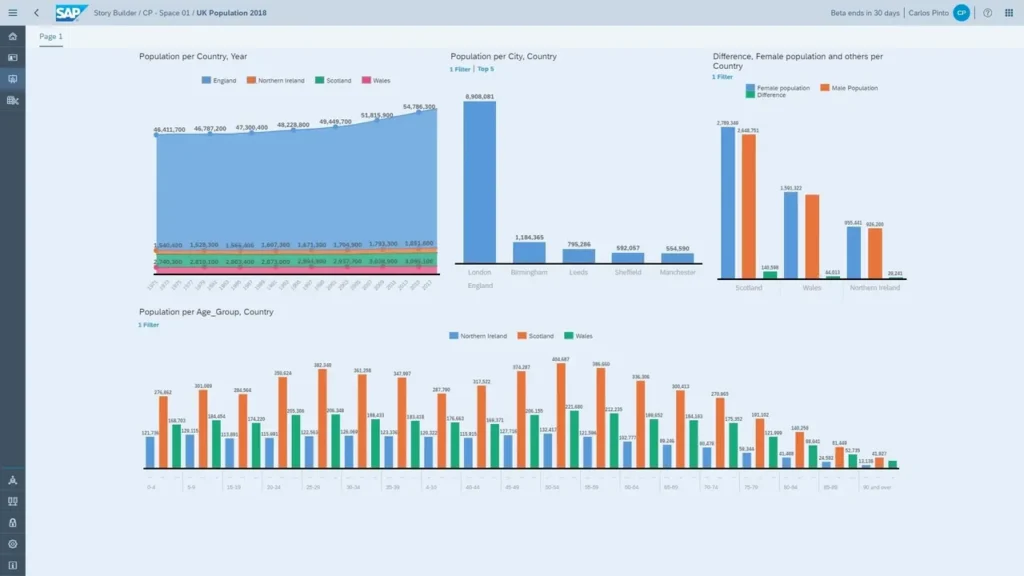
I will not go into detail on SAC, since it is not the objective of this blog. I will just show the final aspect of my story and some final conclusions: Women’s population is higher than men population in the four countries, or the population gap between London and the rest of the cities in the UK.
Conclusions
Although there is still much to do (see roadmap), my first impressions are quite positive and I am really excited about the possibilities of DWC:
It is a necessary tool (if everything is moving to the cloud, DataWarehouse too)
it has all the benefits of Cloud Computing (cost savings, security, flexibility, scalability, mobility, collaboration, automatic updates, etc.)
it includes SAP Analytics embedded (providing DW and Analytics services in one single tool)
and it is easy to use (in fact the idea is that it can be used by business users, without the need of the IT department).
The current SAP strategy is a hybrid scenario between BW/4HANA and DWC, finding the right balance between on-premise and cloud deployment (at least until everything moves to the cloud definitely). Let’s stay tuned to the evolution of the tool and the reception by the market!

Leave a comment